Last updated on February 28th, 2020 at 03:51 pm
KPIs come from asking the right questions before looking at the data or analytics. Otherwise, you can get overwhelmed with all of the interesting pie charts, graphs and tables and waste time. So, before delving in consider a good business question.
Btw, these questions came from Avinash Kaushik years ago. I use them to quickly evaluate the performance of a website over any given period of time (not just at year end). And I’m going to interpret these time tested questions as we know the world today.
1. Where do people come from?
Traffic sources can be evaluated by sorting according to bounce rate, average visit duration and pages/visit for each source. In Google Analytics click on Acquisition > All Traffic.
For lead generation sites I particularly look for traffic sources with the highest number of visits, the highest average visit duration and the highest pages/visit. I usually export the data to excel and sort accordingly.
Also, check for low quality traffic and wrong landing pages
The fastest way in GA is click on Behavior > Site Content > Landing Pages and list the top 25 landing pages according to visits.
When you identify a landing page with low quality traffic, click on the landing page to drill down to other dimensions. Here you will find near the top “Primary Dimension,” click on “Source” to see all traffic sources for this landing page.
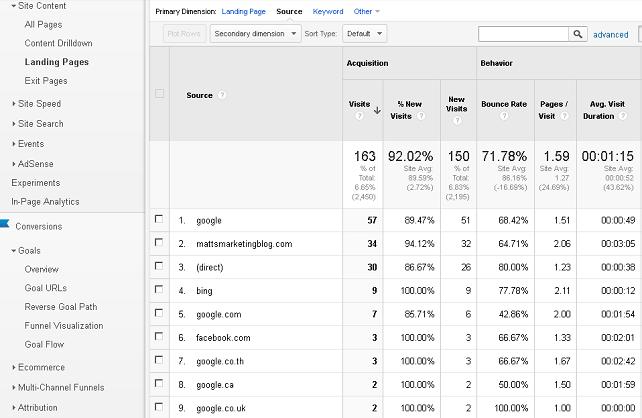
If the source of low quality traffic to the landing page is a search engine other than Google (Google no longer allows keyword data to pass through), you can click on the “Keyword” dimension to see the keywords from Bing, Yahoo, Yandex, etc.
When you identify poor performing keywords and traffic sources for your top 25 landing pages, add them to your SEO task list or to your decision list.
If you’d like a worksheet to help you prioritize tasks for this exercise, contact me and I’ll send it over.
2. What content is being consumed?
- Top 10 entry pages (Landing Pages in Google Analytics)
- Top 10 most viewed pages (All Pages in GA)
- Top 10 product or service pages
This gives you insight about content that draws people to your site. The most viewed pages may tell you what most people want or are interested in.
The top 10 product pages for an ecommerce site is a metric that ought to be monitored perhaps on a weekly basis because it tells you what is in demand and what is not. Any page with a buy button is a top priority page (or money page) and the entire focus of the site should be to send qualified traffic to these pages. The best way to view the top 10 product pages in GA is under Conversions > Ecommerce > Product Performance.
A similar thing could be said about service pages for lead gen sites. You might setup mini conversions for these pages.
3. How do you measure outcomes?
Conversions is where most people jump in with web analytics, understandably, but without context from the above two exercises the opportunities to improve might be over looked.
One of the best ways to measure outcomes is to set up automated reports in GA so you can compare results to prior time periods. You’ll want to setup year over year reports, quarter over quarter reports and perhaps week over week reports for each of the four areas that apply to your business.
Increased revenue
For lead gen sites it’s easy to setup and track goals within GA under Conversions > Goals, but extracting revenue can be challenging. It’s best to sync up the leads from your website with a customer relationship management system like salesforce.com where you can track leads and interact with your prospect until she becomes a customer.
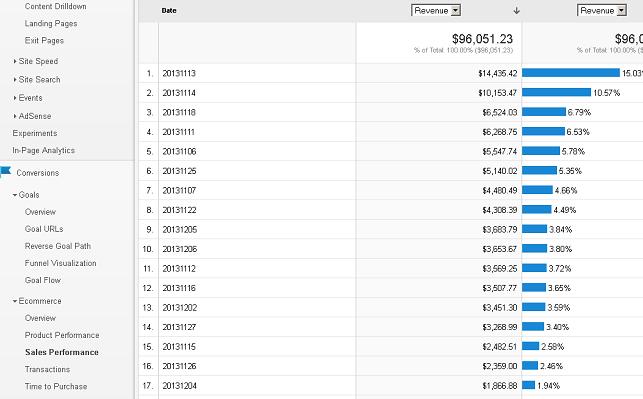
For ecommerce sites Google Analytics provides the Ecommerce section (under Conversions) specifically designed for sites that sell products. It can be challenging to setup this section so that it provides accurate, useful data so you can make great decisions. [Shameless Plug: We properly set up GA Ecommerce for all types of shopping carts and ecommerce stores.]
The quick and dirty way to get to this data within GA Ecommerce is under Sales Performance.
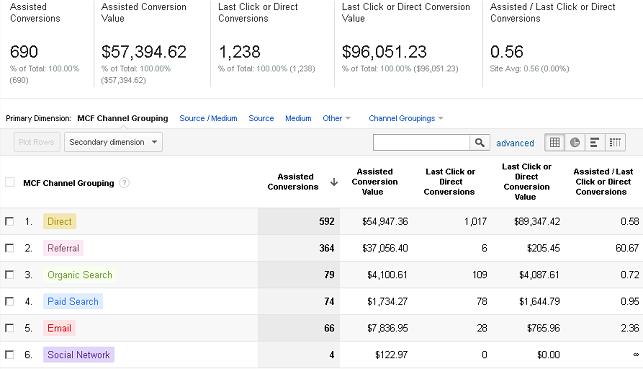
Another GA tool useful for both lead gen and ecommerce sites is under Conversions > Multi-Channel Funnels. This helps you understand the different touch points with assisted conversions and which touch points were first vs. last in the process.
Reduced cost
Measuring costs and comparing them year over year, quarter over quarter, etc. can reveal some real opportunities. Knowing your costs or margin is one part in getting to the ROI for a campaign which is often the bottom line for success or failure in marketing.
Link Adwords with your GA account to see spend in your reports. For Bing Ads, ad networks and other paid advertising use Cost Data Import – a new GA feature to upload your click and cost data so you can compare costs across all paid channels.
Return on investment (ROI) = Total revenue generated (per campaign) – Total spend
Get the details about how the revenue was generated. For example:
- How much traffic does it take to generate a lead or sale?
- What is the conversion rate?
- How many customers did you serve over the year?
- What was the average transaction per customer?
- How many sales per customer?
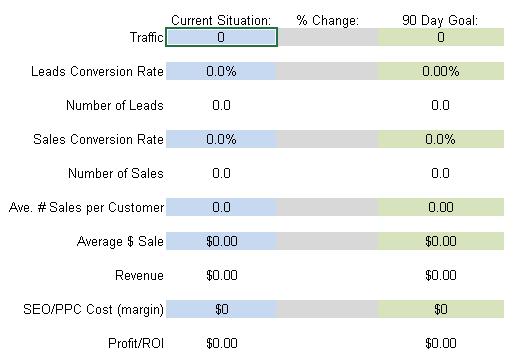
With this info you can see where you are today and where you want to be tomorrow. Here are two useful ROI calculators:
- ROI Calculator for Ecommerce sites
- ROI Calculator for lead gen sites
Btw, this is a great time to set some goals…
Increased customer satisfaction and retention
Customer satisfaction and retention boils down to good usability on your site: site load time (all browsers and devices), readability, ease of navigation, clear purpose, site search works, prioritized communication at the top, etc. These lead to lower bounce rates, more time on site and more page views per visit.
Surveying your users is another great way to measure satisfaction and retention. I like 4Q’s questions for website users. Upon exit, the user will be asked four simple questions, here are the first three:
- What is the purpose of your visit to our site today?
- Were you able to complete your task today?
- If you were not able to complete your task today, why not?
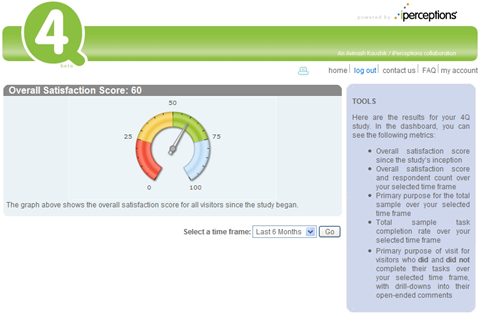
4Q is free and customizable, learn more here
Visitor loyalty and recency
Visitor recency is a measure of loyalty in terms of how often people come back to your site. In GA you can view Audience > Behavior > Frequency & Recency > Days Since Last Visit.
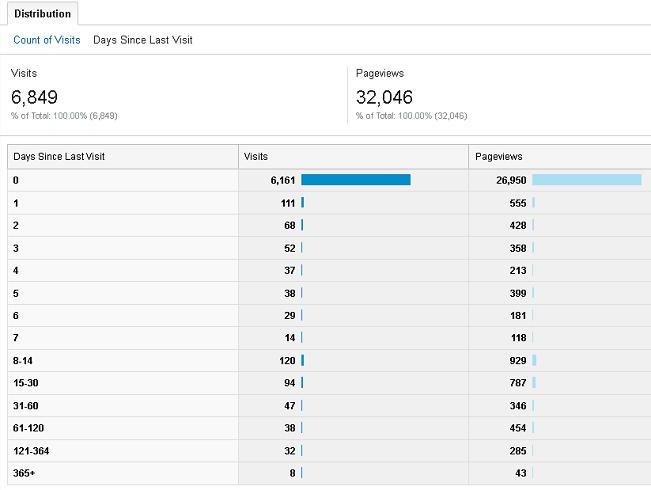
The higher the number of visits with fewer days between visits can tell you how “addicted” your audience or following is with your content. This kind of data is particularly useful if you are doing these kinds of things:
- A membership site
- Involved in audience building/optimization campaigns
- Want to know the post value of any event or marketing campaign where you picked up followers or subscribers
This info can be meaningful to advertisers (for example) about the value of your traffic.
Quantcast reports on crucial measurement insights into web audiences for most websites. One of the items Quantcast tracks is Web Traffic Frequency and breaks it down into 3 categories:
- Passers By, users who visit a site or interact with media once per month
- Regulars, those who visit a site or interact with media more than once but less than 30 times per month
- Addicts, those who interact with a site 30 or more times per month.

How loyal are your web visitors? What percentage of them are passers by, regulars and addicts?
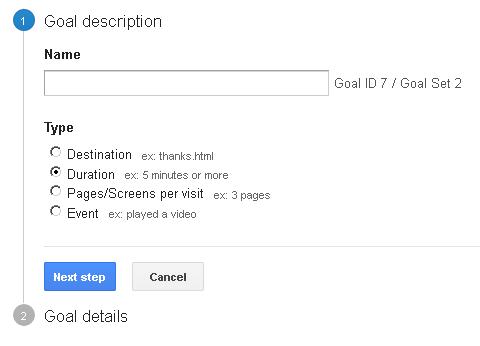
There’s a category of goals within GA that can be setup to measure visitor behavior: duration of visit and pages/screens per visit. Perhaps you are a publisher selling advertising space, your selling point has a lot to do with visits, duration and pages per visit of a specific demographic. These are KPIs you can track in GA, after all Quantcast is tracking them.
Create your KPI action plan:
- Get the answers to the first two questions about your website, it might take 10 minutes.
- Identify any changes or additions to Google Analytics to better measure the outcomes that are top priority for your site (goal tracking, etc.)
- Identify any additional tools for your business or website and bookmark them for future reference.
- Identify the top KPIs for your website and get familiar with how best to track these and how often to track them.
- Set SMART goals for each KPI
If you have benefited from this post, share it with someone you know and subscribe to my newsletter.