For most businesses there are two types of content to focus on: content that gets a decision (service and product pages) and content that gets shared (blog posts, white papers, etc.) It’s the latter type that I’ll be focusing on in this post.
This type of content is designed to intrigue your target audience (prospects) so that they want to share it with their friends and followers.
Prospects are usually not familiar with your brand unless you give them a good reason to get familiar with it:
- Cheat sheets and checklists
- Answering questions that lots of them are thinking about
- Reporting original research
- Covering a popular conference presentation
- Infographics and video
- Infotainment
- A humorous take on a relevant topic
If you can find a way to marry your brand with content like this, you’ll be well on your way to getting it shared in social media and found in search engines.
A question that comes up is “How do we measure engagement with our content?”
It’s an excellent question because the answers can guide you in creating content on the topics and media that your prospects want to consume and avoid the topics and media that they aren’t consuming (even though you think they are important). In addition to identifying engaging topics you can learn:
- The hottest blog post of the month or quarter
- The top social sites your target audience uses
- Which authors write the most engaging content
A few years ago I used PostRank Analytics and in my opinion they had the best tool for measuring social engagement with content, but Google bought it and integrated some of it into Google Analytics. (If anyone knows of a similar tool for measuring content engagement let us all know in the comments.)

PostRank Analytics measured engagement events. Engagement events are individual activities performed using specific social networks, sites, or applications. One tweet is an engagement event, for example, so is posting one comment, or a vote for a post on BizSugar.
PostRank Analytics also assigned points to various engagement events based on the level of difficulty. I don’t recall the exact points, but it went something like this:
- Link, trackback – 12 points
- Comment – 10 points
- Tweet, Like, vote, bookmark – 7 points
- Page view – 1 point
From the point system came Engagement Scores and from that Engagement Trends. For more details on how PostRank Analytics used to work, check out this post.
Measure all engagement events for all content designed to be shared broadly
Many engagement events are captured in Google Analytics with Google Social Interaction Tracking. When you login to your account, click: Acquisition > Social > Network Referrals
Here you’ll see the main social networks sending traffic to your site.
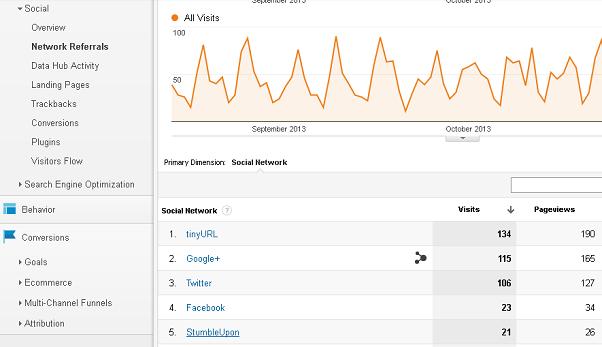
- What are the top social networks that send traffic to your site?
- Which social network has the highest average visit duration and pages/visit?
From here you can drill down into the social networks to learn the specific URLs that garnered the most interaction.
Data Hub Activity helps to show some of the activity from social sites that share their social network activity with Google. This is great of course, except that there are only 21 social networks that share their data with Google at this point: Blogger, Delicious, Diigo, Disqus, Google+, Meetup, Reddit and Typepad to name the popular ones.
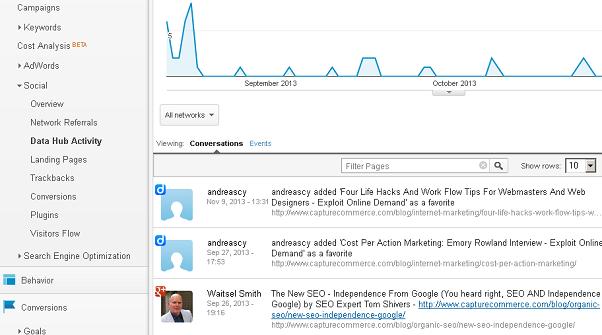
This is the biggest limitation when monitoring social engagement events via Google Analytics, but I’ll mention some alternatives later.
You can toggle between conversations and events to see the activity.
- Which social data hubs bring the most activity?
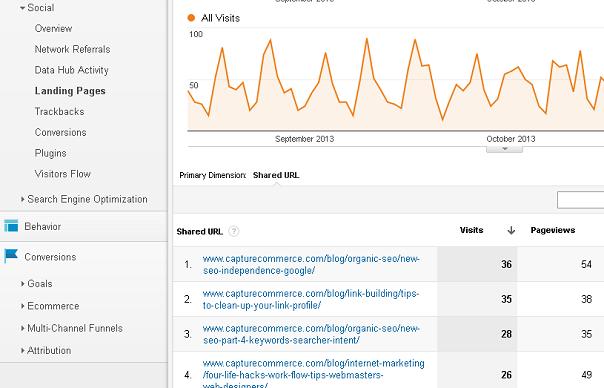
Landing Pages is similar to Network Referrals except you are able to see which pieces of content brought the most interaction across all monitored social networks. And you can drill down into each URL to see the social networks that sent the traffic to your site.
- What content generated the most page views across all social networks?
- Which content has the highest average visit duration and pages/visit?
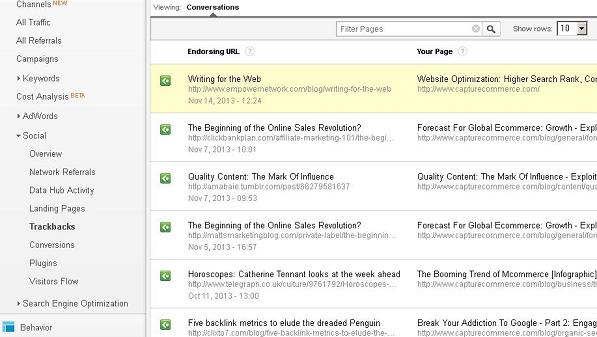
Trackbacks report links to your content from other sites along with the number of visits from that link.
- Which content has the most links pointing to it?
- Which links to that content generate the most visits?
Conversions – if you have defined goals for your site within Google Analytics and/or have setup the Ecommerce section of GA, this area will help you identify the social networks and campaigns that have the most impact on your goals and ecommerce transactions.
In addition, if you have Attribution setup within GA, you’ll be able to see which social sites assisted with a conversion.
- Which social sites had the most impact on your conversion goals?
- Which social sites did the most assisting with your conversion goals?
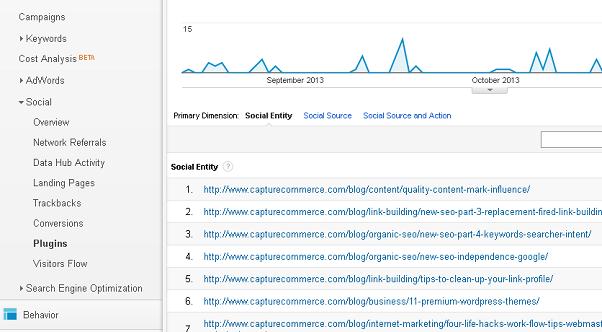
Plugins – if you are using social plugins that Google Analytics can track, like ShareThis, on your content pages, you’ll be able to see which pieces of content get shared the most from these buttons and the social networks they were shared to. To set this up properly check this link.
This is a different metric from those above because it measures your content consumers sharing activity with their followers.
- Which content do your content consumers share the most?
- Which social sites do your content consumers share to the most?
Now let’s run through a quick example from my site and use the Google Analytics Social features to tally up the engagement score.
First, I set the evaluation time period. In this case I set it to the past 3 months.
Starting with Landing Pages I want to identify content that generated the most page views across all networks and content with the highest average visit duration. The intersection of these two metrics can be revealing. The winner for this time period is: The New SEO – Independence From Google
That’s 54 page views (from social media) at an ave. visit duration of 1 minute 40 seconds. Engagement events = 54; engagement points = 54.
When I drill down into this URL, I find that Google+ sent the most traffic.
This post received 9 comments, 7 links, 2 conversions, and 194 social media shares and votes. That’s 266 engagement events and if I use the point system outlined above that brings in an engagement score of 1616 for this single piece of content.
So here are some of the metrics and KPIs you want to track. And of course you can prioritize and score these metrics to create your own KPIs:
- Page views
- Number of comments
- Trackbacks and links from other sites
- Traffic from links
- Likes, votes, mentions, bookmarks, etc.
- Top social network traffic
- Top social network shared to by content consumers
- Average visit duration
- Conversion goals
There’s more to uncover the value of each piece of content but this should get you started. The real magic comes after you have tallied up engagement scores for all content you are doing out reach with.
If you want to track traffic from other social networks within Google Analytics, you can setup a custom segment for it. Kristi Hines in 4 Tools That Improve Your Social Media Analytics explains how to setup a custom segment in GA for this purpose (toward the end of the post).
There are a number of great social media analytics paid tools. Here are a couple, but share those you like in the comments.
You’ve heard it before – you can’t improve what you don’t measure. If I’m your coach you’re going to start tracking and measuring because when you do, you will automatically make the proper adjustments until your content begins hitting on all cylinders with your target audience.
If you didn’t know this stuff or had an “Ah-ha” moment leave a comment, and you probably need me as your online marketing coach, so contact me.
10 replies to "How To Create Content That Prospects Want To Consume"
We can’t improve what we measure – so true! As we can see Google Analytics provides a lot of information for free (at least for now :)) and we need to make use of that information to see how our content is performing is various ways and what kind of traction it is gaining.
Thanks so much for the detailed post!
Hi Jane, glad you liked all the details.
Very interesting post, Tom!
Social engagement is somewhat “easy” to measure, just checking the number of Tweets, or Likes, or Google+1’s.
You listed some very good points to measure content engagement.
For instance, a blog without comments is a dead blog, in my opinion.
Thanks for sharing!
Hi Erik, thanks for the comment. Yep, blog posts without comments is bad but a post with no social engagement is horrific! When that happens it’s time to evaluate the topic, writer and target audience again.
Hi
Thanks for interesting post, even in well known tools you can always find some new features that can help you even more.
Nice post Tom.
I published an article on how to set up Google Analytics dashboards. I also created 5 custom dashboards that should suit different analysis needs and have added links to import them in two clicks. Have a read and I’m keen to get your thoughts stuartjdavidson.com/google-analytics-dashboards/
Thanks Stuart. Nice importable dashboards you have there.
You can also import directly from the GA community. When creating a new dashboard, click on “Import from Gallery” and you’ll get all kinds of free dashboards.
Thanks for the follow-up Tom. I actually forgot to mention that – there’s many other useful dashboards people have created
I miss PostRank 🙁
PostRank is dead, long live PostRank Analytics!